Every unit, live in your browser
Each F60 TC comes with FLOYD’s own SCADA system. You and our service team see the plant in real time – from any browser, worldwide, over the integrated 4G connection. Problems show up as trends long before they become stoppages.
- Browser-based – no software to install, on PC, tablet or phone
- Role-based access with personal logins
- Preventive alarming before values become critical
- Remote diagnosis and software updates by FLOYD
- Beckhoff industrial control, integrated 4G connection
- SLA, ticketing and updates; several units can be combined into a virtual power plant
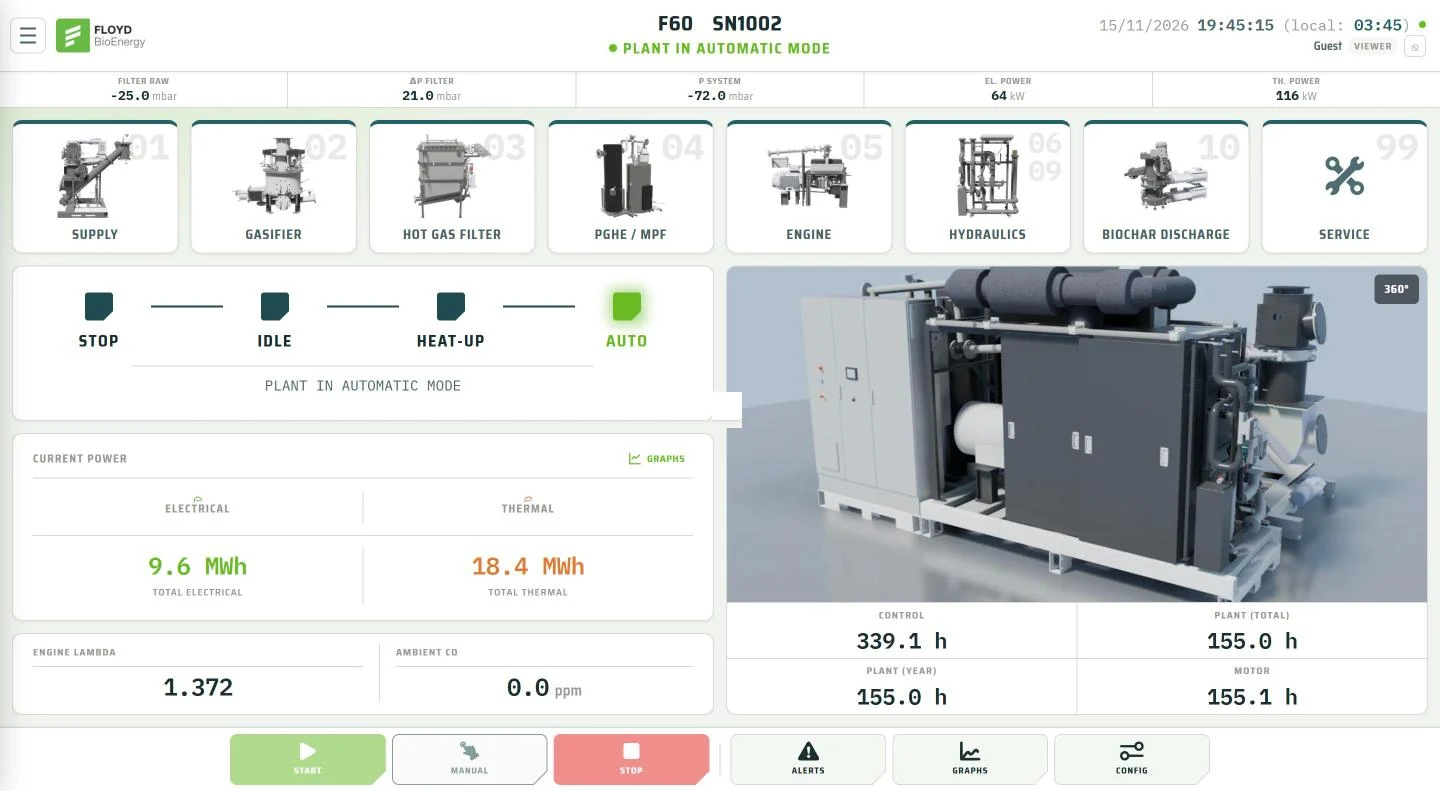
Plant status at a glance
The start screen shows the operating state from stop to automatic, electrical and thermal power, energy produced, operating hours and key pressures – next to a rotating 3D model of the unit.
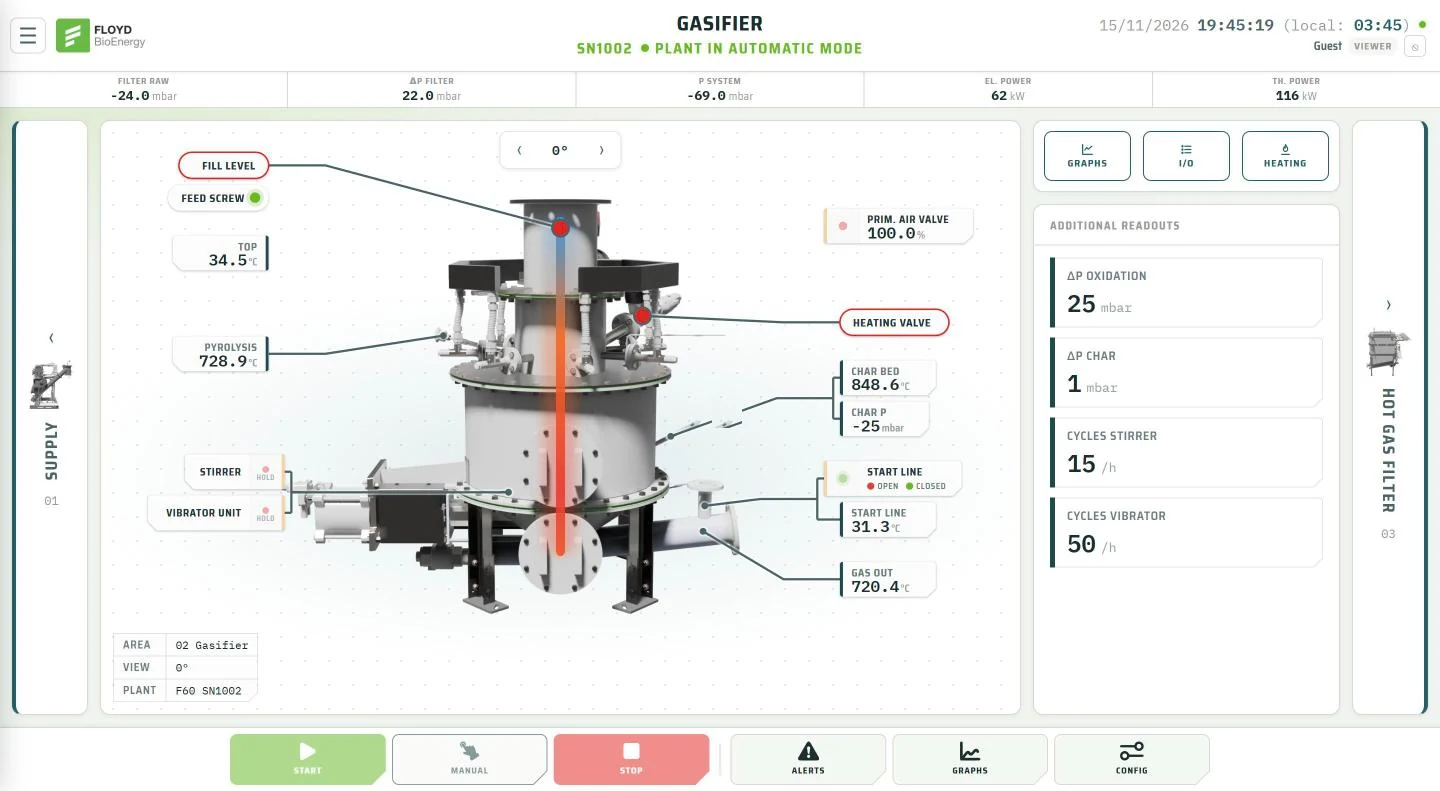
Interactive plant areas
Fuel supply, gasifier, hot-gas filter, gas cooling, engine, hydraulics and biochar discharge each have their own screen. Every sensor sits where it is on the real machine: temperatures, pressures, fill levels, valves and drives.
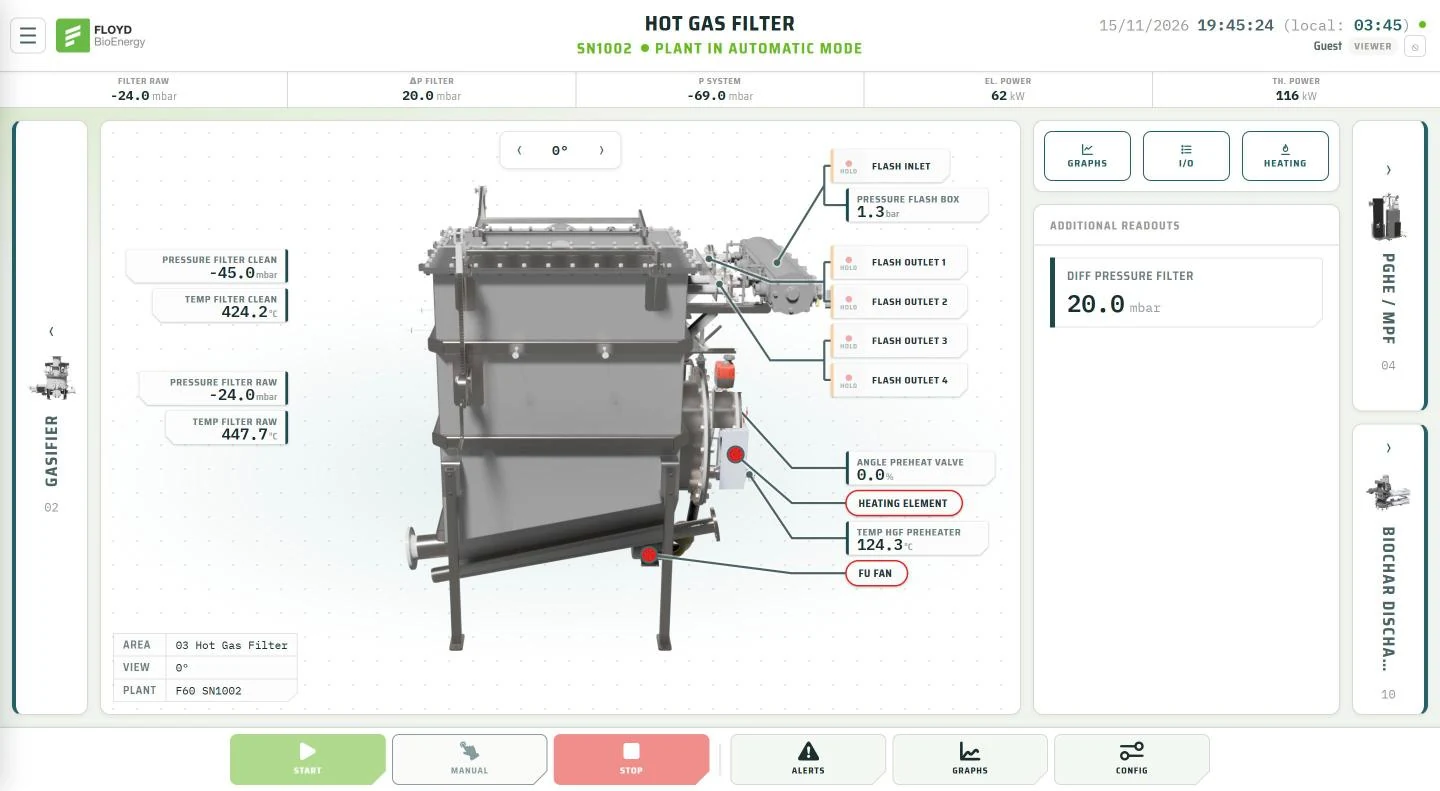
Hot-gas filter and engine in detail
Filter pressures and temperatures, filter cleaning, engine speed, lambda, oil level and exhaust temperatures – the values our technicians use to plan the next service.
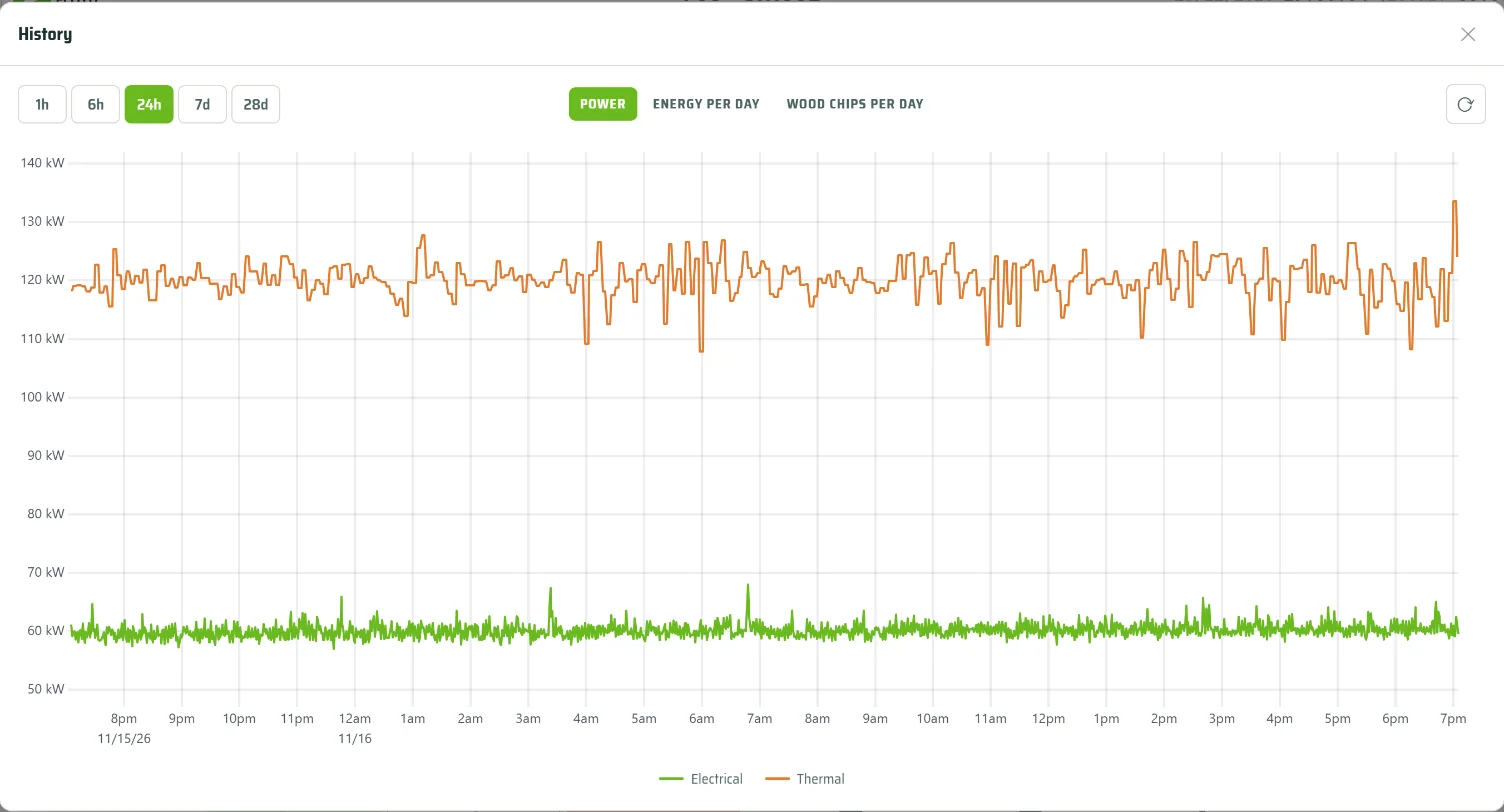
Trends from one hour to 28 days
Every signal is recorded. Trends over 1 hour, 6 hours, 24 hours, 7 days or 28 days make slow changes visible – the basis for preventive maintenance and fewer unplanned stops.
Fuel and biochar
Fill levels, conveyors and slide gates from the bunker to the gasifier, chip consumption in m³, and the biochar discharge with its own temperature monitoring.
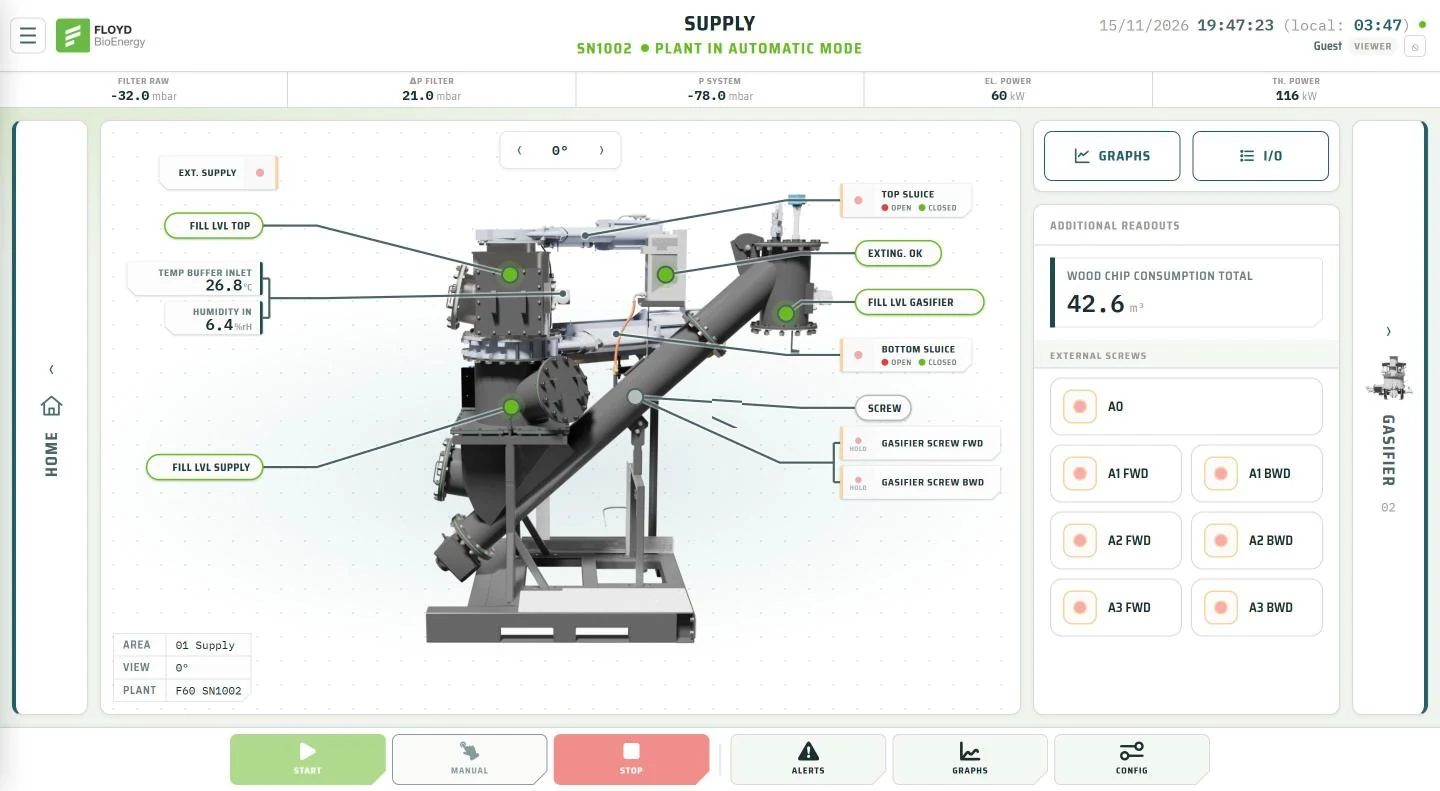
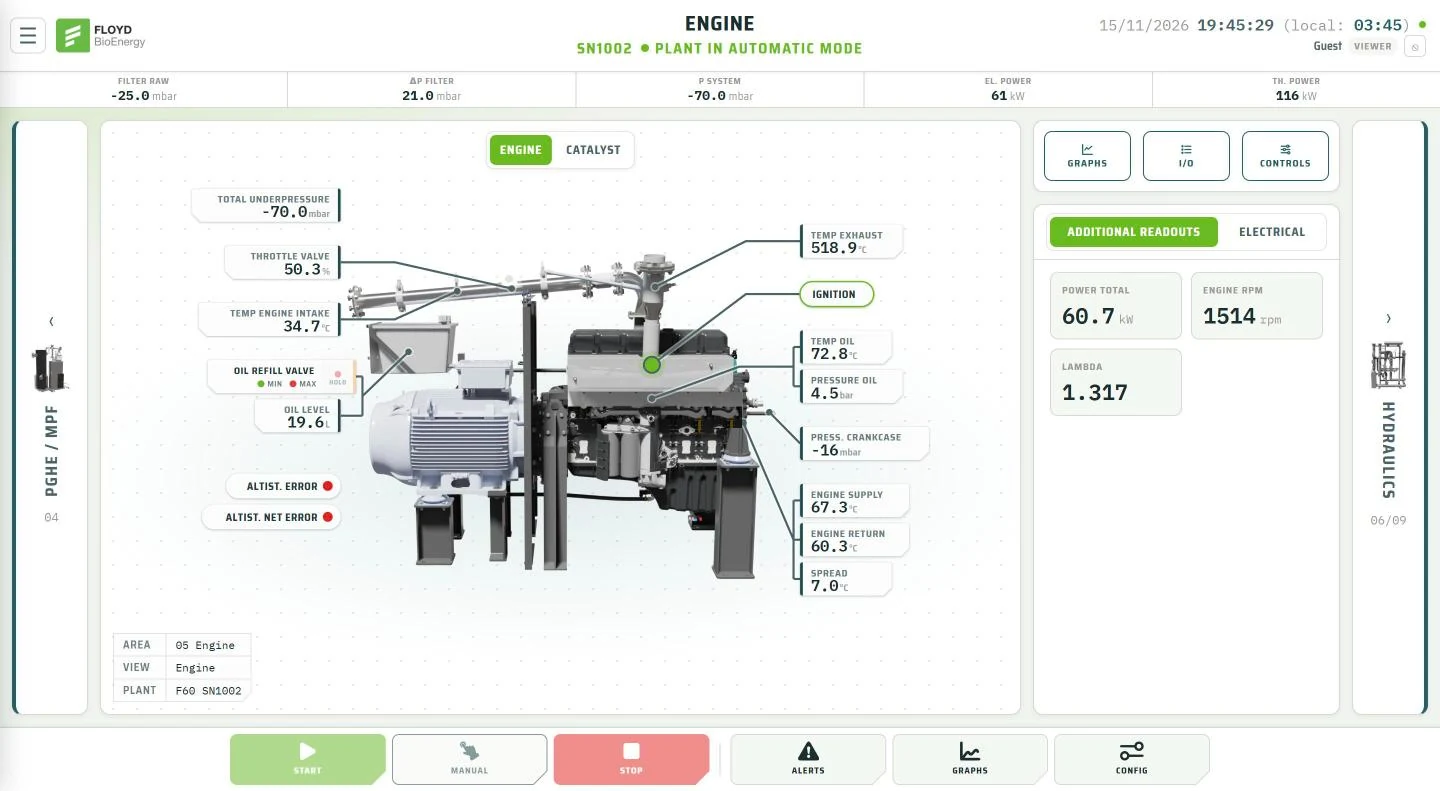
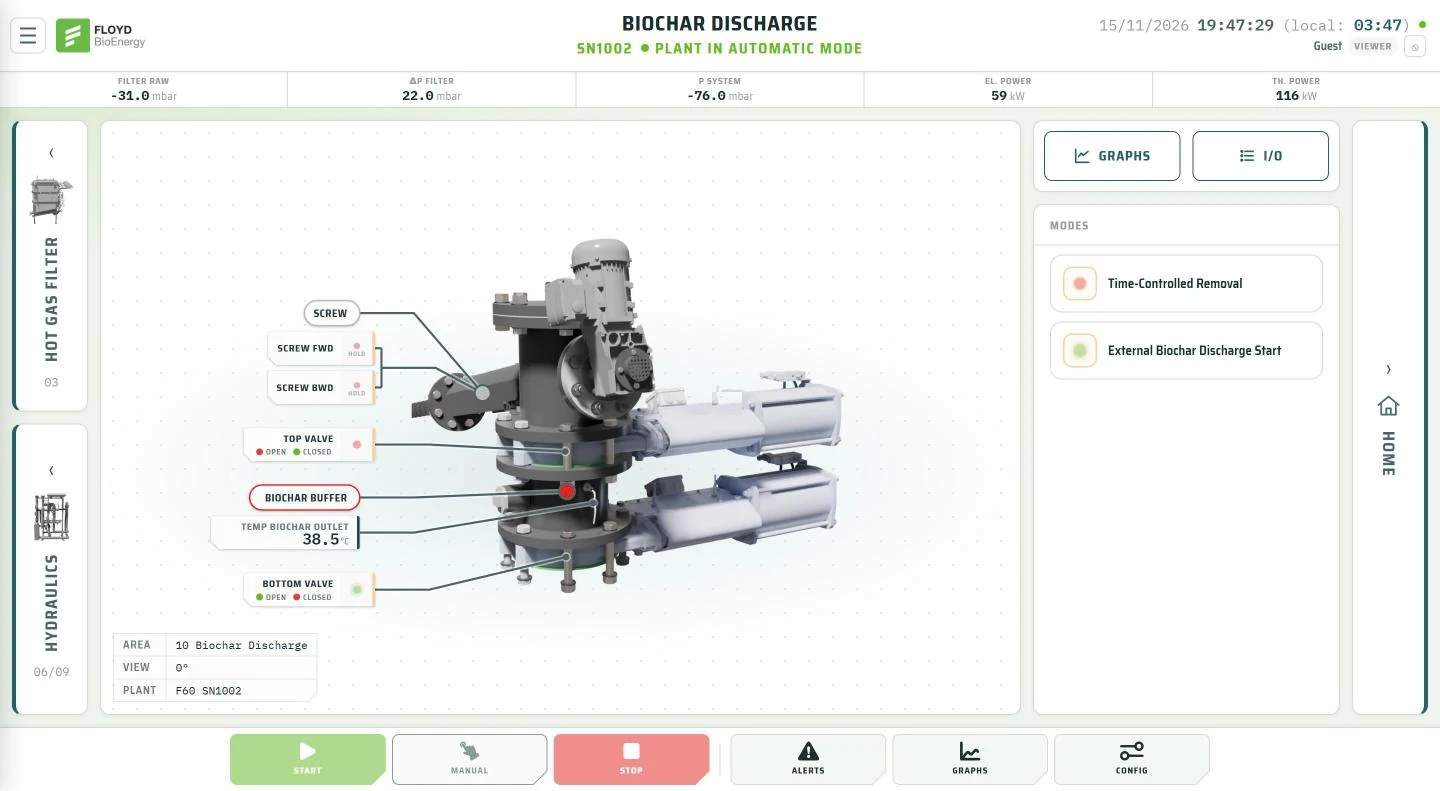
Screenshots from a running F60 at our site in Griffen.